Author

admin

Browsing

In a discovery that offers a glimmer of optimism amid a turbulent year for the diamond industry, Rio Tinto (ASX:RIO,NYSE:RIO,LSE:RIO) has unveiled a 158.2 carat yellow diamond from its Diavik diamond mine, located in the remote Northwest Territories (NWT).

The rough gem, described by Rio Tinto as a “miracle of nature,” is one of only five yellow diamonds exceeding 100 carats ever recovered from Diavik since it began operations in 2003.

The diamond, unearthed from one of the most challenging mining environments on Earth, underscores Diavik’s reputation for producing rare and high-quality stones.

While the mine is best known for its white gem-quality diamonds, less than one percent of its output consists of yellow diamonds, making this latest find a significant event in the mine’s 22 year history.

“This two billion year old, natural Canadian diamond is a miracle of nature and testament to the skill and fortitude of all the men and women who work in Diavik’s challenging sub-Arctic environment,” said Matt Breen, COO of Diavik Diamond Mines, in a press release.

The Diavik mine, jointly operated by Rio Tinto and located entirely off the grid, has also become a model for sustainable mining in the Arctic. It has integrated renewable energy sources into its operations, including a wind-diesel hybrid facility introduced in 2012 and a solar power plant completed in 2024.

This commitment to sustainability adds further value to its diamonds, which carry a provenance often sought by ethical consumers and collectors alike.

This is not the first time Diavik has made headlines with extraordinary finds. In 2018, the mine unearthed a 552 carat yellow gem-quality diamond — the largest ever found in North America.

Known as the ‘Canadamark’ yellow diamond, the discovery eclipsed the previous record set by the 187.7 carat Diavik Foxfire diamond, found in 2015.

Portions of the Foxfire were later cut into two brilliant-cut pear-shaped diamonds, which sold at a Christie’s auction for US$1.3 million.

But while such discoveries reinforce Diavik’s status as a producer of rare gems, they also arrive during a precarious moment for the broader NWT mining sector.

The territory’s three major diamond mines — Diavik, Ekati, and Gahcho Kué — are grappling with steep financial losses, with Diavik alone reporting a US$127 million loss in 2024. These financial headwinds stem from a combination of inflationary pressures, weakened global diamond prices, and unexpected disruptions, including a tragic plane crash near Fort Smith early last year.

Industry advocates are now urging the territorial government to step in and provide relief, particularly in the form of easing property tax burdens.

Blue diamond steals spotlight in US$100 million Sotheby’s exhibit in Abu Dhabi

On the international front, a 10 carat rare blue diamond from South Africa has emerged as the crown jewel of Sotheby’s latest diamond exhibition in Abu Dhabi.

Part of an eight stone showcase valued at over US$100 million, the blue diamond is expected to fetch around US$20 million when it goes to auction in May.

Sotheby’s selected the UAE capital for the exhibit due to the region’s increasing appetite for high-end diamonds. “We have great optimism about the region,” said Quig Bruning, the company’s head of jewels in North America, Europe, and the Middle East.

“We feel very strongly that this is the kind of place where you have both traders and collectors of diamonds of this importance and of this rarity.”

Petra Diamonds delays Cullinan tender as US tariff shockwaves hit market

Meanwhile, Petra Diamonds (LSE:PDL,OTCPink:PDLMF) announced last week that it would delay the sale of gems from its Cullinan mine due to uncertainty over new US tariffs on imports — including diamonds.

The delay comes amid heightened concerns that the tariffs, introduced last week, could disrupt global diamond flows and further depress an already sluggish market.

Petra had already sold 176,000 carats from its Finsch and Williamson mines for US$18 million in its fifth tender of the year — a modest 9 percent price increase over the previous round.

However, overall tender revenue is down 25 percent year-on-year, totaling $103 million so far in 2025, compared to US$138 million during the same period in 2024. Shares of Petra fell 6.1 percent following the announcement.

The Cullinan Mine, famously the source of the largest gem-quality diamond ever discovered, has recently struggled to yield high-quality stones, further complicating Petra’s recovery efforts amid market volatility and its ongoing restructuring plan.

The diamond market isn’t the only luxury segment to be impacted by geopolitical trade tensions.

On April 10, Prada Group (HKEX:1913) which owns luxury brand Prada, announced its acquisition of the Versace brand from Capri Holdings (NYSE:CPRI) for US$1.38 billion, marking a significant consolidation in the luxury fashion industry.

The deal reunites two iconic Italian brands and positions Prada to better compete with industry leaders like LVMH (OTC Pink:LVMHF,EPA:MC) and Kering (EPA:SSKEG). Capri Holdings, which acquired Versace for US$2.1 billion in 2018, faced challenges with the brand’s performance, including a 15 percent decline in revenue in late 2024. The sale allows Capri to refocus on its core brand, Michael Kors, and address financial pressures following a blocked merger with Tapestry (NYSE:TPR) in 2023.

According to a January report from McKinsey, The luxury goods sector faces a challenging outlook in 2025, with global growth projected to slow to between 1 percent and 3 percent annually through 2027.

This deceleration follows a period where price increases accounted for over 80 percent of growth from 2019 to 2023, a strategy that has now reached its limit as aspirational consumers become more price sensitive.

Securities Disclosure: I, Giann Liguid, hold no direct investment interest in any company mentioned in this article.

Keep reading…Show less
This post appeared first on investingnews.com

One of Russia’s most outspoken generals, sacked and detained after a withering attack on the Defense Ministry two years ago, is returning to the front, according to his lawyer.

But according to Russian state media, he’s been handed a poisoned chalice: front-line command of a notorious battalion of ex-prisoners that has suffered massive casualties in Ukraine.

Two years ago, Major General Ivan Popov was the decorated commander of the 58th Combined Arms Army in southern Ukraine, receiving plaudits for his leadership.

Then he made a mistake – sending a voice note to colleagues excoriating the leadership of the Defense Ministry, and saying he’d been fired for complaining.

Maj. Gen. Ivan Popov as the commander of the 58th Army.

“The armed forces of Ukraine could not break through our army from the front, (but) our senior commander hit us from the rear, treacherously and vilely decapitating the army at the most difficult and tense moment,” Popov said in the message, sent in July 2023.

Most of his ire was reserved for the Russian military’s chief-of-staff, Valery Gerasimov.

Popov said that when he complained about a lack of artillery support and other issues, “the senior commanders felt the danger in me and swiftly, in one day, concocted an order for the Minister of Defense, removed me from the order, and got rid of me.”

Kateryna Stepanenko, at the Washington-based Institute for the Study of War, says that Popov’s dismissal “outraged Russian ultranationalists, officers, and veterans, who accused the Russian MoD of removing Popov to mask problems in the Russian military.”

The military establishment was especially sensitive to criticism at the time – less than a month after the abortive revolt by Wagner mercenary group boss Yevgeny Prigozhin.

Life for Popov was soon to get worse. At first, he was sent to Syria to be deputy commander of the Russian contingent there, but in May last year he was arrested for alleged fraud, a charge he has consistently denied.

Prosecutors sought a six-year jail sentence if convicted, and Popov was dismissed from the armed forces. But his supporters continued to speak up for him.

Stepanenko believes the Kremlin “largely failed to convince the Russian ultranationalists, officers, and veterans of Popov’s alleged involvement in the embezzlement case, resulting in persistent backlash online.”

Popov wrote an open letter to Russian President Vladimir Putin, which was published in state media in late March, appealing to be allowed to return to the battlefield. He described Putin as his “moral guide and role model” whose example “made me finally understand what the legendary words mean: ‘a cool head, a warm heart and clean hands.’”

Popov’s wish has now been granted, after a fashion.

Last week, Russian state media reported that his lawyer and the Ministry of Defense had agreed to Popov’s request to return to active duty rather than face the prospect of a prison sentence.

Popov’s lawyer, Sergei Buinovsky, was quoted on TASS as saying: “We, together with the Ministry of Defense, have a motion to suspend on the case… with the positive decision to send Ivan Ivanovich to the SVO (The Special Military Operation.)” Moscow continues to use this term to refer to the full-scale invasion of Ukraine it launched in 2022.

It’s yet to be confirmed that the military court has agreed to the deal, but Popov’s supporters among Russian military bloggers rejoiced.

“The legendary combat general returned to the front!” wrote Vladimir Rogov, a popular blogger.

But there was a sting in the tail. Popov would not be returning to his beloved 58th Army.

On Thursday, Russian business daily newspaper Kommersant reported that Popov would “be sent to the SVO not as a regular stormtrooper, but as the commander of one of the Storm Z units,” citing a source in the security forces.

That same day, Kremlin spokesman Dmitry Peskov declined to comment on a call with journalists “on the intention of General Popov, accused of embezzlement, to take up a special operation.”

But Stepanenko describes Popov’s assignment as “effectively a death sentence because the Russian military command primarily uses ‘Storm Z’ penal detachments in suicidal frontal assaults.”

The Kremlin has continued to support the use of prisoners in combat. Putin recently promised to get members of Storm Z veteran status.

“We will definitely fix this. I don’t see any problems here,” Putin said at a meeting last month. “I have great connections, I will come to an agreement with both the government and the deputies,” he added.

As the Russian military seeks to bolster the number of experienced officers in Ukraine, it’s increasingly turning to those who have fallen out of favor.

“Putin appears to have set up a new redemption system in which disgraced officials and commanders have a chance at regaining Putin’s favor, provided they publicly plead guilty to their charges and then volunteer to fight in Ukraine,” says Stepanenko.

Popov has denied the charges against him and a military court is yet to green-light the deal between his lawyer and the Defense Ministry.

But he is certainly familiar with Russia’s notorious units of ex-convicts, which played an outsize role in the assault on Bakhmut in 2023, suffering immense casualties in the process.

When in charge of the 58th Army, Popov was affiliated with a battalion of former prisoners known as “Storm Gladiator,” a special assault unit within Storm Z.

It had “hundreds of convicts with prior military experience who received training from former Wagner Group and Chechen ‘Akhmat’ forces,” says Stepanenko. But it suffered significant losses in what became known as “meat grinder assaults,” frontal infantry assaults on well-defended positions. Detachments of Storm Gladiator had a survival rate of 40%, according to some investigations.

As and when he returns to the battlefield, Popov is likely to need all his military prowess to keep his ex-prisoners’ battalion, and himself, alive.

This post appeared first on cnn.com
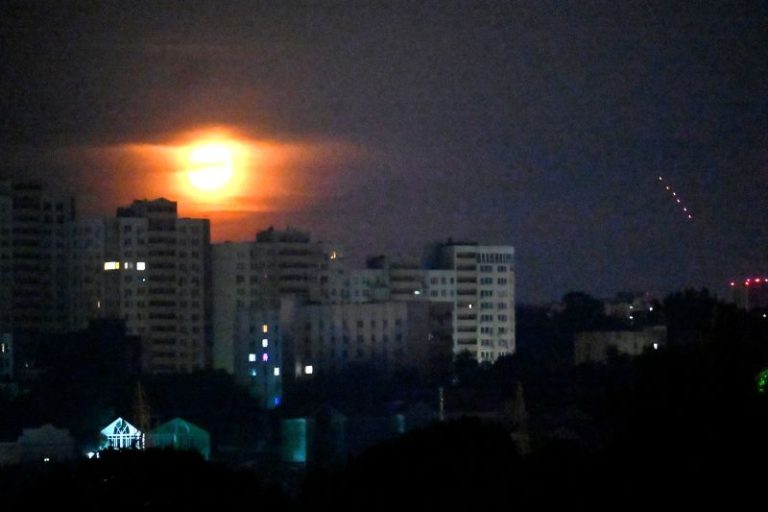
For hundreds of millions of people living in India and Pakistan the early arrival of summer heatwaves has become a terrifying reality that’s testing survivability limits and putting enormous strain on energy supplies, vital crops and livelihoods.

Both countries experience heatwaves during the summer months of May and June, but this year’s heatwave season has arrived sooner than usual and is predicted to last longer too.

Temperatures are expected to climb to dangerous levels in both countries this week.

Parts of Pakistan are likely to experience heat up to 8 degrees Celsius above normal between April 14-18, according to the country’s meteorological department. Maximum temperatures in Balochistan, in country’s southwest, could reach up to 49 degrees Celsius (120 Fahrenheit).

That’s like living in Death Valley – the hottest and driest place in North America – where summer daytime temperatures often climb to similar levels.

Ayoub Khosa, who lives in Balochistan’s Dera Murad Jamali city, said the heatwave had arrived with an “intensity that caught many off guard,” creating severe challenges for its residents.

“This has intensified the impact of the heat, making it harder for people to cope,” he said.

Neighboring India has also been experiencing extreme heat that arrived earlier than usual and its metrological department warned people in parts of the country to brace for an “above-normal number of heatwave days” in April.

Maximum temperatures in capital Delhi, a city of more than 16 million, have already crossed 40 degrees Celsius (104 Fahrenheit) at least three times this month – up to 5 degrees above the seasonal average – the meteorological department said.

The searing heat is being faced in several neighboring states too, including Rajasthan in the northwest, where laborers and farmers are struggling to cope and reports of illness are beginning to emerge.

Maximum recorded temperatures in parts of Rajasthan reached 44 degrees Celsius (111 Fahrenheit) on Monday, according to the meteorological department.

Anita Soni, from the women’s group Thar Mahila Sansthan, said the heat is much worse than other years and she is worried about how it will impact children and women in the state.

When the laborers or farmers head out, there is an instant lack of drinking water, people often feel like vomiting, they fall sick, or they feel dizzy, she said.

Farmer Balu Lal said people are already falling sick due to working in it. “We cannot even stand to work in it,” he said. “When I am out, I feel that people would burn due to the heat outside.”

Lal said he worries about his work and how he will earn money for his family. “We have nowhere else to go,” he said.

Testing survivability limits

Experts say the rising temperatures are testing human limits.

Extreme heat has killed tens of thousands of people in India and Pakistan in recent decades and climate experts have warned that by 2050 India will be among the first places where temperatures will cross survivability limits.

Under heatwave conditions, pregnant women and their unborn children are particularly at risk. “There is unexplained pregnancy loss and early babies,” said Neha Mankani, an advisor at the International Confederation of Midwives in Karachi.

“In the summers, 80% of babies are born preterm with respiratory issues because of the weather. We also see an increase in pregnancy induced hypertension, (which could) lead to preeclampsia – the leading cause of maternal mortality.”

India and Pakistan, both countries with glaring disparities in development, are expected to be among the nations worst affected by the climate crisis – with more than 1 billion people predicted to be impacted on the subcontinent.

The cascading effects will be devastating. Likely consequences range from a lack of food and drought to flash floods from melting ice caps, according to Mehrunissa Malik, a climate change and sustainability expert from Pakistan’s capital Islamabad.

Communities without access to cooling measures, adequate housing and those who rely on the elements for their livelihoods will feel the effects much more acutely, said Malik.

“For farmers, the weather is erratic and difficult to predict,” she said. “The main challenge is the fact that temperatures (are) rising at a time when crops aren’t at the stage to be harvested. They start getting ready earlier, yields get lower, and in this dry heat they need more water… If your plants are still young, severe heat causes little chance of them making it.”

Tofiq Pasha, a farmer and environmental activist from Karachi, said summers begin much earlier now.

His home province, Sindh, which, along with Balochistan, has recorded some of the hottest global temperatures in recent years, suffered a major drought during the winter months and the little rainfall has led to water shortages, he said.

“This is going to be a major livelihood issue among farmers,” Pasha said, explaining how temperatures also affect the arrival of pests. “Flowers don’t set, they fall, fruits don’t set, they fall, you have pest attacks, they decimate the crop, sometimes it gets too hot… the cycles are messed. Food production is extremely affected.”

Heatwaves have in the past have increased demand for electricity, leading to coal shortages while leaving millions without power. Trains have been cancelled to conserve energy, and schools have been forced shut, impacting learning.

This post appeared first on cnn.com

Australia’s copper industry could be facing supply chain disruptions and market trade uncertainty following US President Donald Trump’s imposed 10 percent tariffs on certain goods.

While the red metal is exempted from the imposition to protect US industries reliant on imported raw materials, the tariffs have caused a shift to the copper industry in general.

Australia, a key player in the industry, forms part of the broader market experiencing significant volatility.

Over the years, Australia has been recognized as a major copper producer, ranking eighth in global production. Major reserves can be found in South Australia, Western Australia and Queensland.

On top of these deposits, copper is also extracted as a by-product in several nickel and gold mines in the country.

A study by Dr. Scott French of the University of New South Wales (UNSW) Business School said that it’s hard to predict precisely where the tariff’s impact will be greatest given complex global supply chains, “but the overall effect is going to be negative.”

Weaker prices and production

It is no secret that global trade tensions have led to weaker prices for major metals, including copper.

Prices reached a record of US$5.24 per pound towards the end of March, but quickly fell down after the tariff announcements due to fears of reduced industrial demand and global economic slowdown.

This is attributed to unsettled global markets, mainly as investors are losing confidence given the constant change in traditional trade flows.

Copper supplies are also subjected to rerouting, with approximately 100,000–150,000 tonnes redirected to the US ahead of potential tariffs.

Globally, copper smelting activity also took quite the fall. Data from geospatial intelligence company Earth-i said that inactivity capacity index rose from 3.4 percent to 14.9 percent in March.

This marks the lowest inactivity record since May 2023, with smelting activity outside China now five percent lower compared to January.

With this, Australia, among other producers, is encouraged to up its game.

“One should also keep in mind that one of the reasons Trump imposed these tariffs is to on shore, to bring manufacturing back home,” Benchmark said in a copper webinar in April. “So, it would rather see these projects in the US than in other parts of the world.”

Benchmark also believes that amid all these changes, the US is facing supply deficits for other minerals, so it may in the end need to secure from other producers such as Australia.

Import and export

US and Australian copper may not necessarily have a direct cause-and-effect relationship, but the imposition of tariffs poses major threats to Australia’s import and export relationships with other countries.

China, among the countries largely impacted by the tariffs, is a significant importer of Australian copper. Investors and companies have already seen reduced or inconsistent demand, which could lead to a slowdown in the country’s economy.

Should this slowdown result in a lesser need for raw materials, then Australian miners would potentially deal with unexpected oversupply.

Still, economists and advisors say that Australia must remain competitive.

“I can already feel the push for protective tariffs to keep out foreign products competing with domestic production. I’m very, very wary of something like that because I find that Australia has done well by having very low trade barriers,” added Dr. French of UNSW.

“We don’t want to go back to the experience from earlier decades where local manufacturing was very highly protected and very uncompetitive … “So that’s why I think maintaining competitiveness is important, and I would strongly caution against trying to enact any sort of protective tariffs to isolate the domestic market for these products.”

Copper in the next years

While copper and other essential minerals for decarbonisation are facing uncertainties at the present, the fact that they will be needed in the future has not changed.

In the Benchmark webinar, it was mentioned that a strong outlook for copper demand is highly possible over the long run.

“We’re folding in the energy transition, route to 2030, 2040 and 2050. I don’t think copper is going anywhere,” said Benchmark Head of Strategic Initiatives Mike Finch.

The Minerals Council of Australia, in a commentary on the imposition of tariffs, said that Trump’s decision is “a stark reminder of the disruptive consequences that can arise from trade volatility and economic uncertainty.”

“(While) details remain unclear, this development further reinforces the need for Australia to get the economic fundamentals right to protect and enhance our global competitiveness; to better position ourselves in times of economic uncertainty,” the council wrote.

“It also underscores the need for Australia to accelerate free trade deals and secure supply chain partnerships with like-minded economies.”

Securities Disclosure: I, Gabrielle de la Cruz, hold no direct investment interest in any company mentioned in this article.

Keep reading…Show less
This post appeared first on investingnews.com

Here’s a quick recap of the crypto landscape for Monday (April 14) as of 9:00 p.m. UTC.

Bitcoin and Ethereum price update

At the time of this writing, Bitcoin (BTC) was priced at US$84,833.31 and is up 1.2 percent in 24 hours. The day’s range has seen a low of US$84,050.56 and a high of US$85,667.65.

Bitcoin performance, April 11, 2025.

Bitcoin performance, April 11, 2025.

Chart via TradingView.

The recovery appears to be related to last week’s announcement of partial import tariff relief, but the uncertainty of ongoing US-China trade tensions kept Bitcoin from rallying above US$86,000.

Ethereum (ETH) is priced at US$1,635.11, a 3.1 percent increase over the past 24 hours. The cryptocurrency reached an intraday low of US$1,624.37 and a high of US$1,677.74.

Altcoin price update

  • Solana (SOL) is currently valued at US$131.19, up 2.4 percent over the past 24 hours. SOL experienced a low of US$128.75 and a high of US$134.05 on Monday.
  • XRP is trading at US$2.15, reflecting a 1.8 percent decrease over the past 24 hours. The cryptocurrency recorded an intraday low of US$2.11 and a high of US$2.18.
  • Sui (SUI) is priced at US$2.21, showing a decreaseof 0.9 percent over the past 24 hours. It achieved a daily low of US$2.20 and a high of US$2.33.
  • Cardano (ADA) is trading at US$0.6397, trading flat over 24 hours. Its lowest price on Monday was US$0.6314, with a high of US$0.6548.

Crypto news to know

Kraken expands into stock and ETF trading

Kraken announced on Monday that it will expand beyond cryptocurrencies to offer eligible users trade services for over 11,000 US-listed stocks and exchange-traded funds through Kraken Securities.

Users will be able to trade traditional assets and cryptocurrencies within a single Kraken account. The service is available to select states as part of a phased rollout, with plans to expand to all states and the UK, Europe and Australia.

Euro-sacked stablecoin EURC sees growth amidst strengthening Euro

Circle’s Euro-backed stablecoin, EURC, is experiencing growth amidst a strengthening Euro, its market cap growing from around $83 million at the beginning of 2025 to $204 million at the time of writing.

The euro has been rallying while the dollar falls amidst escalating trade tensions between the US and the rest of the world. Obchakevich Research founder Alex Obchakevich expects Euro Coin will continue to grow even as nations reach a trade deal that he projects will stabilize the Euro at around $1.11.

“I predict EURC to grow to 400 million euros by the end of this year. This will be further impacted by MiCa regulatory support and economic challenges,” he said.

MANTRA (OM) token price collapse and aftermath

Following a dramatic price collapse in the MANTRA (OM) token on Sunday (April 13) that wiped out billions of dollars in market cap, CEO John Mullin spoke in a now-deleted AMA thread hosted by Cointelegraph on X.

During the Monday discussion, Mullin denied accusations of insider selling or “rug pulling,” saying the plunge occurred after exchanges closed positions without notice.

On-chain data revealed that around US$227 million worth of OM was deposited from 17 wallets, with two linked to strategic investor Laser Digital. Arkham data revealed those wallets moved millions of OM to OKX and Binance in the days leading up to the collapse.

“The Mantra association, our key investors, our advisers — no one has sold, and we are going to categorically deny and also provide verifiable proof onchain proof that this is the case,” Mullin stated in the AMA, adding that he “(doesn’t) know who those wallets belong to.”

Mantra is up 10.8 percent to US$0.65 at the time of writing, far below its April 9 price of US$6.76.

Strategy buys US$285 million in BTC amid volatility

Michael Saylor’s firm, Strategy, capitalized on sharp equity market swings last week, purchasing 3,459 more BTC valued at US$285.8 million between April 7 to 13.

The buy was funded through its at-the-market equity offering as shares fluctuated from -11 percent to +25 percent, demonstrating the firm’s commitment to BTC accumulation even during periods of financial instability. Strategy’s Bitcoin holdings now total around US$45 billion, representing about 2.5 percent of the total BTC supply.

The firm also disclosed a forthcoming US$5.9 billion unrealized loss due to new accounting rules requiring market-based valuations for digital assets. Even so, Strategy remains on track with its plan to raise US$42 billion through 2027 for continuous Bitcoin acquisitions, reinforcing its identity as a long-term Bitcoin maximalist corporate play.

Metaplanet now 9th largest public Bitcoin holder

Japanese investment firm Metaplanet has acquired 319 BTC at an average price of US$83,147, bringing its total treasury to 4,525 BTC. That makes it the ninth largest publicly traded Bitcoin holding company.

This acquisition is part of its broader treasury strategy to build shareholder value through Bitcoin accumulation, initiated in December 2024. The company now has a cost basis of US$408.1 million and evaluates its Bitcoin performance using Bitcoin yield, which hit 95.6 percent in the first quarter of 2025.

Backed by sophisticated financial engineering such as bond issuances and stock acquisition rights, Metaplanet has executed over 41 percent of its “210 million plan,” demonstrating significant momentum.

The firm’s bold approach also reflects Japan’s evolving stance toward crypto as a mainstream asset class and could influence similar treasury strategies in Asia.

CeFi lending drops from 2021 peak, DeFi borrowing soars

The crypto lending market remains well below its former highs, down from US$64.4 billion in 2021 to US$36.5 billion at the close of 2024, according to a new report by Galaxy Digital.

This contraction is largely due to the collapse of major centralized finance (CeFi) lenders like Genesis, BlockFi, Celsius, and Voyager, which together lost 82 percent of their lending capacity during the bear market.

However, decentralized finance (DeFi) has made a stunning recovery, with open borrows jumping from US$1.8 billion in late 2022 to US$19.1 billion across 20 platforms and 12 blockchains — a 959 percent increase. Galaxy attributes this to DeFi’s permissionless nature, transparency, and its resilience during market turmoil that crushed CeFi players.

Today, Tether, Galaxy, and Ledn dominate the surviving CeFi space, accounting for nearly 89 percent of its total activity, while DeFi’s growth hints at a larger shift toward decentralized, non-custodial financial infrastructure in the post-crash era.

Google to enforce MiCA rules on crypto ads

Google (NASDAQ:GOOGL) will begin enforcing stricter ad policies across 27 European countries beginning on April 23, requiring all crypto advertisers to comply with the Markets in Crypto-Assets (MiCA) regulation or be licensed under the Crypto Asset Service Provider framework.

All crypto exchanges and wallet providers advertising on Google must now also be certified by Google, and meet additional national-level legal obligations, further tightening the regulatory net on digital asset marketing.

This marks a significant shift in how crypto services are promoted in the EU and could weed out illicit players while boosting trust in licensed entities. Noncompliance will first trigger a warning before eventual account suspensions, giving advertisers a brief grace period to align with the rules.

Securities Disclosure: I, Giann Liguid, hold no direct investment interest in any company mentioned in this article.

Securities Disclosure: I, Meagen Seatter, hold no direct investment interest in any company mentioned in this article.

Keep reading…Show less
This post appeared first on investingnews.com

From Tokyo rice markets to Wall Street trading floors, candlestick patterns have stood the test of time.

Now, in the high-stakes world of cryptocurrency trading, where government policies can shift the market overnight, understanding these patterns could mean the difference between profit and loss.

In such a volatile environment, traders have continuously searched for signals amid the chaos, and many have claimed that these patterns offer a guiding light.

But how do these candlestick patterns work, and why do traders rely on them? Here’s what you need to know.

History of candlestick patterns

Candlestick charting traces its origins to 18th century Japan, where Munehisa Homma, a wealthy rice trader from Sakata, developed a system to analyze price movements in the rice futures market.

Homma meticulously recorded price fluctuations and identified patterns that reflected market sentiment, realizing that emotions such as fear and greed played a crucial role in price action. His insights allowed him to anticipate market trends, reportedly leading to immense trading success.

Homma’s techniques evolved into a structured system known as the Sakata Rules, which later laid the foundation for modern candlestick patterns. These rules emphasized the importance of recognizing repetitive price formations and interpreting their psychological implications.

Homma’s pioneering work made him legendary in Japan’s trading circles, with some historical accounts claiming he executed 100 consecutive winning trades using his methodology.

Candlestick charts remained largely unknown outside Japan until the late 20th century, where Steve Nison, an American technical analyst, introduced candlestick charting to Western financial markets in the 1980s.

Through extensive research, Nison translated and refined Japanese candlestick techniques, integrating them into modern technical analysis. His 1991 book, Japanese Candlestick Charting Techniques, became a seminal work, widely regarded as the definitive guide on the subject.

Key candlestick patterns you need to know

Candlestick patterns provide traders with crucial insights into market sentiment, signaling potential reversals, continuations, or periods of indecision. These patterns are categorized into three main types:

  1. Bullish patterns indicating possible uptrends
  2. Bearish patterns signaling potential downtrends
  3. Neutral patterns suggesting indecision or continuation

Bullish patterns

Bullish candlestick patterns typically appear after a downtrend, signaling a potential shift in momentum as buying pressure increases. These patterns suggest that buyers are stepping in and that a reversal to the upside may be underway.

Bullish engulfing

Bullish engulfing candlestick pattern.

Bullish engulfing candlestick pattern.

Image via commons.wikimedia.org.

  • Bullish engulfing: A two-candle pattern where a small bearish candle is followed by a larger bullish candle that completely engulfs the previous day’s body. This formation suggests a strong shift in momentum, as buying pressure overwhelms selling pressure. The larger the engulfing candle, the more powerful the signal.

Hammer

Hammer candlestick pattern.

Hammer candlestick pattern.

Image via commons.wikimedia.org.

  • Hammer: A single candlestick with a small body near the top of its range and a long lower shadow. It appears after a downtrend and signals that despite initial selling pressure, buyers regained control and pushed prices back up. A hammer is more reliable when it forms near a significant support level.

Inverted hammer

Inverted hammer candlestick pattern.

Inverted hammer candlestick pattern.

Image via commons.wikimedia.org.

  • Inverted hammer: Similar to the hammer, but with a small body at the lower end of the range and a long upper shadow. This pattern suggests that buyers attempted to push prices higher after a decline, potentially signaling a reversal. It requires confirmation from the next candle closing higher.

Morning star

Morning star candlestick pattern.

Morning star candlestick pattern.

Image via commons.wikimedia.org.

  • Morning star: A three-candle formation that signifies a trend reversal. It starts with a long bearish candle, followed by a small-bodied candle (which may be bullish or bearish) that gaps down, and finally, a strong bullish candle that closes well into the first candle’s body. This pattern suggests that bearish momentum is weakening and buyers are taking control.

Three white soldiers

Three white soldiers candlestick pattern.

Three white soldiers candlestick pattern.

Image via commons.wikimedia.org.

  • Three white soldiers: A powerful bullish pattern made up of three consecutive long bullish candles with small or no wicks. Each candle opens within the previous candle’s body and closes progressively higher. This pattern suggests a strong and sustained uptrend, particularly when accompanied by high volume.

Bearish patterns

Bearish candlestick patterns appear after an uptrend, signaling a potential reversal as selling pressure increases. These formations suggest that buyers are losing momentum, and a downward move may be imminent.

Bearish engulfing

Bearish engulfing candlestick pattern.

Bearish engulfing candlestick pattern.

Image via commons.wikimedia.org.

  • Bearish engulfing: The opposite of the bullish engulfing pattern, this formation occurs when a small bullish candle is followed by a larger bearish candle that completely engulfs the previous day’s body. This suggests a shift from buying to selling pressure, often signaling the start of a downtrend.

Shooting star

Shooting star candlestick pattern.

Shooting star candlestick pattern.

Image via commons.wikimedia.org.

  • Shooting star: The shooting star is a single candle with a small body near the lower end of the trading range and a long upper shadow. It indicates that buyers pushed prices higher, but strong selling pressure forced prices back down, making it a potential reversal signal.

Hanging man

Hanging man candlestick pattern.

Hanging man candlestick pattern.

Image via commons.wikimedia.org.

  • Hanging man: Resembling the hammer, the hanging man appears at the top of an uptrend instead of the bottom. It has a small body and a long lower shadow, signaling that selling pressure is starting to emerge. A confirmation from the next candle closing lower strengthens this bearish signal.

Evening star

Evening star candlestick pattern.

Evening star candlestick pattern.

Image via commons.wikimedia.org.

  • Evening star: The bearish counterpart to the morning star, this three-candle pattern starts with a strong bullish candle, followed by a small-bodied candle that gaps up, and then a long bearish candle that closes well into the first candle’s body. This signals a transition from bullish to bearish momentum.

Three black crows

Three black crows candlestick pattern.

Three black crows candlestick pattern.

Image via commons.wikimedia.org.

  • Three black crows: This pattern consists of three consecutive long bearish candles with small wicks, each opening within the previous candle’s body and closing progressively lower. It signals strong selling pressure and the likelihood of a continued downtrend.

Neutral patterns

Neutral candlestick patterns signal market indecision and can lead to either a continuation of the existing trend or a reversal. Traders should consider additional indicators or confirmation signals before acting on these patterns.

Doji

Doji candlestick pattern.

Doji candlestick pattern.

Image via commons.wikimedia.org.

  • Doji: A candlestick where the opening and closing prices are nearly identical, resulting in a small or nonexistent body. Doji patterns indicate market indecision and can appear in various forms:
  • Standard doji: Signals uncertainty, often preceding a breakout or reversal.
  • Gravestone doji: A bearish signal, with a long upper shadow and no lower shadow, indicating rejection at higher prices.
  • Dragonfly doji: A bullish signal, with a long lower shadow and no upper shadow, showing strong buying interest.

Spinning top

Spinning top candlestick pattern.

Spinning top candlestick pattern.

Image via commons.wikimedia.org.

  • Spinning top: Featuring a small body with long upper and lower shadows, the spinning top reflects a tug-of-war between buyers and sellers, often signaling consolidation or a possible trend reversal.

Combining candlestick patterns with indicators

While candlestick patterns provide valuable insights into market sentiment, relying on them alone can lead to false signals, especially in a volatile market like Bitcoin.

To increase accuracy, traders often combine these patterns with technical indicators that help confirm trends, momentum and potential reversals. Below are some of the most effective indicators to use alongside candlestick patterns:

  1. Moving averages — Moving averages smooth out price fluctuations and help traders identify the prevailing trend. They can also act as dynamic support and resistance levels.

Application: If a bullish candlestick pattern (eg., bullish engulfing, morning star) appears while Bitcoin’s price is above a key moving average (such as the 50 day or 200 day MA), this strengthens the signal that an uptrend may continue.

Conversely, if a bearish candlestick pattern (eg., bearish engulfing, shooting star) forms below a moving average, it increases the likelihood of further downside.

  1. Relative Strength Index (RSI) — RSI measures the speed and magnitude of price movements on a scale of zero to 100. A reading above 70 suggests overbought conditions (potential reversal or pullback), while a reading below 30 suggests oversold conditions (potential buying opportunity).

Application: A bullish candlestick pattern forming when RSI is below 30 strengthens the case for a trend reversal (eg., a Hammer appearing in oversold conditions could indicate a strong buying opportunity).

A bearish candlestick pattern forming when RSI is above 70 suggests that the price may be primed for a pullback (eg., a Shooting Star forming in overbought conditions signals potential downside).

  1. Volume analysis – Volume represents the number of trades executed and provides insight into the strength behind price movements. A price move with high volume is more significant than one with low volume.

Application: If a bullish reversal pattern (eg., morning star) appears with high volume, it confirms strong buyer interest and increases the likelihood of a sustained uptrend.

If a bearish reversal pattern (eg., bearish engulfing) forms with high volume, it signals aggressive selling pressure and strengthens the bearish outlook.

Common mistakes to avoid

While candlestick patterns are valuable tools, it is very easy to misuse them—leading to unnecessary losses. Understanding common pitfalls can help investors refine their strategies and improve decision making.

  1. Trading candlestick patterns without confirmation
    Many traders see a single candlestick pattern, such as a Bullish Engulfing or Shooting Star, and immediately enter a trade without waiting for additional confirmation. This leads to false signals and premature decisions.

How to avoid it: Always combine candlestick patterns with other indicators (eg., RSI, moving averages, volume analysis). Furthermore, look for follow-through price action — a second candle that confirms the expected move.

  1. Ignoring the importance of timeframes
    A common trap is assuming that a candlestick pattern on a 5 minute chart carries the same weight as one on a daily or weekly chart. Shorter timeframes are more prone to noise and false signals.

How to avoid it: Prioritize patterns on higher timeframes (daily, weekly) for more reliable signals. If trading lower timeframes (eg. 15 minute chart), ensure the pattern aligns with the higher timeframe trend.

  1. Overtrading and chasing every pattern
    Some traders try to trade every candlestick pattern they see, leading to excessive trades, emotional decision making and mounting losses. Overtrading often results from fear of missing out or lack of patience

How to avoid it: Stick to high-probability setups where multiple factors confirm the trade. Wait for patterns to form at key levels, not in random price areas. Set clear entry and exit rules instead of reacting impulsively.

  1. Failing to adapt to market conditions
    Candlestick patterns do not work the same way in all market environments. Some traders blindly follow textbook interpretations without considering other factors. Candlestick patterns are purely technical, but the market is heavily influenced by fundamental news. Ignoring events like ETF approvals, regulatory shifts, or major financial institution involvement can lead to poor trading decisions.

How to avoid it: Always check news before trading, especially for large moves. Avoid trading right before or after high-impact events, as volatility can distort patterns. Use candlestick analysis in combination with fundamental trends.

Final thoughts

Candlestick patterns have stood the test of time, but while these patterns offer valuable insights into market sentiment, they are not foolproof signals. Successful trading is a holistic skill — it means understanding that context, confirmation and discipline are just as important as recognizing the patterns themselves.

By combining these patterns with other essential factors and indicators, traders can refine their strategies and make more informed decisions.

Securities Disclosure: I, Giann Liguid, hold no direct investment interest in any company mentioned in this article.

Keep reading…Show less
This post appeared first on investingnews.com

Ole Hansen, head of commodity strategy at Saxo Bank, shares his outlook for the gold, silver, copper and oil sectors as tariff uncertainty continues.

‘If you’re actively trading these markets, keep your position to a level that reflects the new and higher volatility,’ he said, urging investors to be mindful amid the current turmoil.

Securities Disclosure: I, Charlotte McLeod, hold no direct investment interest in any company mentioned in this article.

This post appeared first on investingnews.com

Sen. Bernie Sanders, I-Vt., blasted President Donald Trump and Elon Musk for undermining democracy, while comparing billionaire ‘oligarchs’ in both parties to ‘heroin addicts’ whose drug of choice is ‘greed,’ at a rally Monday night.

The comments came during a ‘Fight The Oligarchy’ rally in Idaho, which included an address by progressive ‘Squad’ Rep. Alexandria Ocasio-Cortez, D-N.Y. Both politicians took most of their time speaking on stage to blast Trump and Musk repeatedly by name, and blamed them for destroying democracy in an effort to provide benefits for their billionaire friends. 

‘I used to talk about oligarchy. And people say, What is he talking about? Everybody knows what I’m talking about tonight. When Trump got inaugurated, sitting right behind them were the three wealthiest people in this country: Musk, Bezos and Zuckerberg,’ Sanders told a raucous crowd in Nampa, Idaho Monday night.

‘Well, these guys, these oligarchs, have a major, major addiction problem. And you know what it is? It is greed,’ Sanders added during his Monday address. ‘They’re like heroin addicts. They can’t control themselves. They need more and more, and they do not care who they step over in order to get another billion dollars. So we are going to take care of their addiction problems.’

Sanders noted that billionaire ‘oligarchs’ can come from both political parties – Republicans and Democrats – but the night’s sentiment was directed towards those billionaires in Trump world. 

‘Understand that all of this right now is what it feels like to be governed by billionaires. This is what oligarchy feels like,’ AOC told rally goers. ‘This concentration of power, greed and corruption is oligarchy. It’s oligarchy in America, and we must acknowledge the terrifying moment that we are in right now.’

Both Sanders and AOC referenced the president’s inauguration as a key example of the ‘oligarchy,’ pointing to Jeff Bezos, Mark Zuckerberg and Elon Musk being in attendance and sitting very close to the president. Sanders also noted the ’13 other billionaires who Trump had nominated’ to be in his cabinet, who were also in attendance that day.

Sanders and AOC also took their moment on stage Monday night to call for action. 

‘It will never be just institutions and politicians and officials alone that uphold our democracy. It will always be the people, the masses, who refuse to comply with authoritarian regimes, who are the last and strongest defense of our country and our freedoms. It is you. It is you Idaho,’ AOC told the crowd. 

‘We are here today because we choose democracy, we choose freedom, we choose justice. And that means we must choose to out-organize the oligarchy. We must do away with the power of big money.’

This post appeared first on FOX NEWS

Perth, Australia (ABN Newswire) – Basin Energy Limited (ASX:BSN) (OTCMKTS:BSNEF) is pleased to provide an update on work at the Bjorkberget (‘Bjork’), Ravaberget (‘Rava’) and Virka green energy metals projects (collectively the ‘North Sweden Projects’), refer to figure 5*.

Basin Identifies Structures Associated with Mineralisation at North Sweden Projects

Key Highlights

– Structural relogging of 48 historical drillholes across the Virka and Bjorkberget projects completed

o Detailed structural records now available for 28 priority historical drillholes from Bjorkberget, with 137 samples currently at laboratory for multielement analysis. Additional 71 samples from Bjorkberget core are awaiting shipment to laboratory for analysis

o All Virka historical drill core has been relogged. Samples are awaiting shipment to the laboratory for sample preparation

o Mineralising structure trends clearly identified in core; associated alteration and mineral assemblage (pending analysis results) will be used as vector for future drillhole targeting

– Pulp re-analysis of 2 samples above detection limit (>2.95 U3O8) by fusion XRF from Bjorkberget 2024 field mapping return highly positive results:

o BJK004: Exceeded detection limits again returning greater than 5.9% U3O8 from granite boulder sample with visible yellow oxide staining located at the base of an outcrop

o BJK008: Returned 5.4% U3O8 from rhyolitic and fine-grained granite boulder sample with visible mineralisation and yellow oxide staining located at the base of an outcrop

Basin’s Managing Director, Pete Moorhouse commented: ‘The structural relogging and multielement analysis results are adding a crucial modern interpretation of the variety of mineral systems at play in our North Sweden Projects portfolio. Most of the historical drillholes were shallow, and the mineralisation observed in drill core appears to not have been closed off at depth and along strike, where the potential continuations are masked by a thin veneer of glacial cover. Moreover, the final rock chip results add confirmation that an exciting mineral assemblage exists in our project area that is still largely underexplored.

Generating good quality data through the relogging and sampling of the available historical core is a cost-effective approach to unlock the full potential of the North Sweden Project portfolio.’

Results have now been received from re-analysis of the two Bjork samples that returned above detection limit uranium mineralisation (>2.95% U3O8) previously reported in Basin’s ASX release1 dated 13 February 2025. The options for analysis are limited in Europe, with one sample again reaching the maximum detection limit (>5.9% U3O8) and the second sample returning 5.4% U3O8 (Figure 4, Appendix 3*). No further analysis was completed on the other elements reported.

The Company continues advancing structural relogging (Figures 1 and 2) and sampling of historical drillholes at the Bjork, Rava and Virka projects with 48 drillholes relogged out of 101 total drillholes. A total of 137 samples are currently at the laboratory pending analysis. Recently, Basin has acquired multiple projects where limited government run historic exploration identified uranium mineralisation; but rarely assessed polymetallic prospectivity including rare earth, gold and base metal opportunities.

Structural logging and sampling of historical core

Relogging and sampling continues on historical drill cores for the North Sweden Projects, with 101 drillholes from the combined project areas having been located to date.

The primary focus of the relogging program is to examine the different mineralisation systems identified through historic exploration and through recent field mapping, to study the structure framework to establish potential for blind mineralisation, and to examine alteration known to be associated with mineralisation and sample relevant core intervals that may be used as a vector for future exploration.

Drill core examination comprises detailed geological and structural logging and detailed photography. These observations along with a radiometric core scan using a handheld gamma-ray spectrometer (Exploranium GR-130 Minispec) are used to define sample intervals to send to the laboratory for analysis.

Basin has completed the logging of all holes identified from Virka, along with 28 priority drillholes out of 39 at Bjork. There are currently 137 samples from Bjork at ALS Laboratory from key intervals undergoing analysis. Core samples are being analysed with multielement analysis to continue evaluating the potential for green energy metals at the Company’s North Sweden Projects.

The historical core examined from the Bjork project mostly comprise a homogenous leucocratic granite composed of up to 7% mafic constituents including magnetite. Lithologies are more varied in the Virka core, comprised mostly of granite, amphibolite and porphyritic granite. Uranium mineralisation occurs together as fracture/vein infillings and disseminations on core from both projects (Figure 1, Appendix 2). Localised intervals were recorded with visible sphalerite (Figure 2) and nodular sulphides (Figure 1, Appendix 2*). Structural deformation observed in the Bjork core is almost always brittle, with a clear network of microfractures and veinlets consistently bearing magnetite/hematite with visible uraninite (Figure 1, Appendix 2*); small scale breccias and cataclasites are also noted locally.

Re-analyses of samples BJK004 & BJK008 by fusion XRF

Of the twelve samples collected at Bjork during the initial field reconnaissance visit in Q4 2024, two samples, BJK008 and BJK004, returned values above the detection for uranium (>2.95% U3O8) for the chosen ALS analysis method ME-MS89L. Both samples were from boulders with visible yellow oxide staining located at the base of an outcrop.

The pulps of these samples were re-analysed by the laboratory using fusion XRF (ME-XRF15b), which is the only other reliable high-grade uranium analysis method option available locally through ALS.

Analysis results reported (Figure 4 and appendix 3 for details*):

– BJK008 returned 5.38% U3O8

o Initial assay methods (ME-MS89L): U3O8 > 2.95% (above detection limits), Pb 1.39%, Fe 23.4%, 0.13% TREO (74% HREO)

o The sample was collected from a boulder with visible yellow oxide staining located at the base of an outcrop

– BJK004 returned above detection limit for the second analysis technique U3O8 >5.9 % from a boulder with visible yellow oxide staining located at the base of an outcrop:

o Initial assay methods (ME-MS89L): U3O8 > 2.95% (above detection limits), Pb 1.85%, 0.12% TREO (49% HREO), 522 ppm Mo
*While new analysis returned results above detection limit for sample BJK004, the Company is not planning additional analyses due to the high-grade nature of the sample.

Update on Sweden’s proposed changes to uranium exploration and mining

The Swedish government announced an inquiry into overturning the uranium mining moratorium in December 2024. The inquiry recommends uranium be regulated as a concession mineral within the Swedish Mineral Act, allowing for its exploitation like other natural resources. The inquiry’s findings were submitted for consultation with authorities, municipalities and other stakeholders, including a public consultation period which ended on 20 March 2025. Following the consultation, a legislative proposal will be presented to the Swedish Parliament. If approved by Parliament, the proposed legislative amendments are set to take effect by 1 January 2026. The proposal is driven by Sweden’s growing need for critical metals and minerals to support the green transition, as well as by security concerns stemming from the current geopolitical landscape.

*To view tables and figures, please visit:
https://abnnewswire.net/lnk/K77A0529

About Basin Energy Ltd:  

Basin Energy Ltd (ASX:BSN) (OTCMKTS:BSNEF) is a green energy metals exploration and development company with an interest in three highly prospective projects positioned in the southeast corner and margins of the world-renowned Athabasca Basin in Canada and has recently acquired a significant portfolio of Green Energy Metals exploration assets located in Scandinavia.

Source:
Basin Energy Ltd

Contact:
Pete Moorhouse
Managing Director
pete.m@basinenergy.com.au
+61 7 3667 7449

Chloe Hayes
Investor and Media Relations
chloe@janemorganmanagement.com.au
+61 458619317

News Provided by ABN Newswire via QuoteMedia

This post appeared first on investingnews.com