
WASHINGTON — The Senate agreed unanimously early Friday to fund the Department of Homeland Security, but without funding for immigration enforcement and deportation operations.
Senators approved the package at 2:20 a.m. by voice vote following a marathon session.
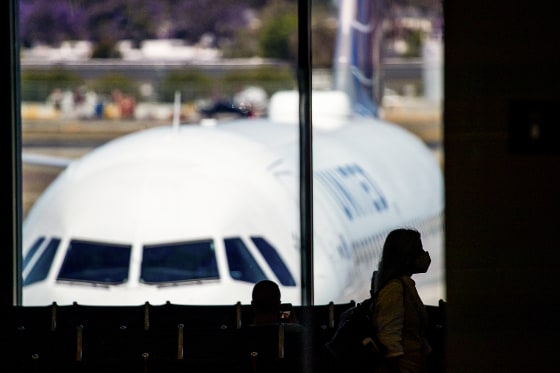
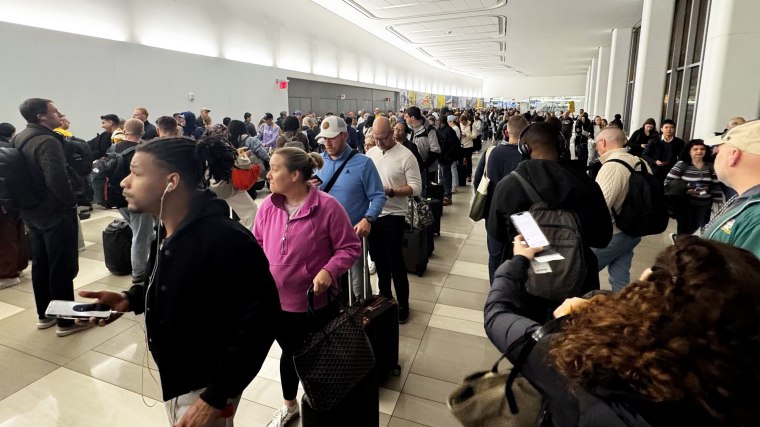
The 42-day funding lapse has seen them go without pay, leading many to call out of work and causing long lines at airports. While the measure still needs to pass the House, the Senate vote paves the way to allow airports to fully function again.
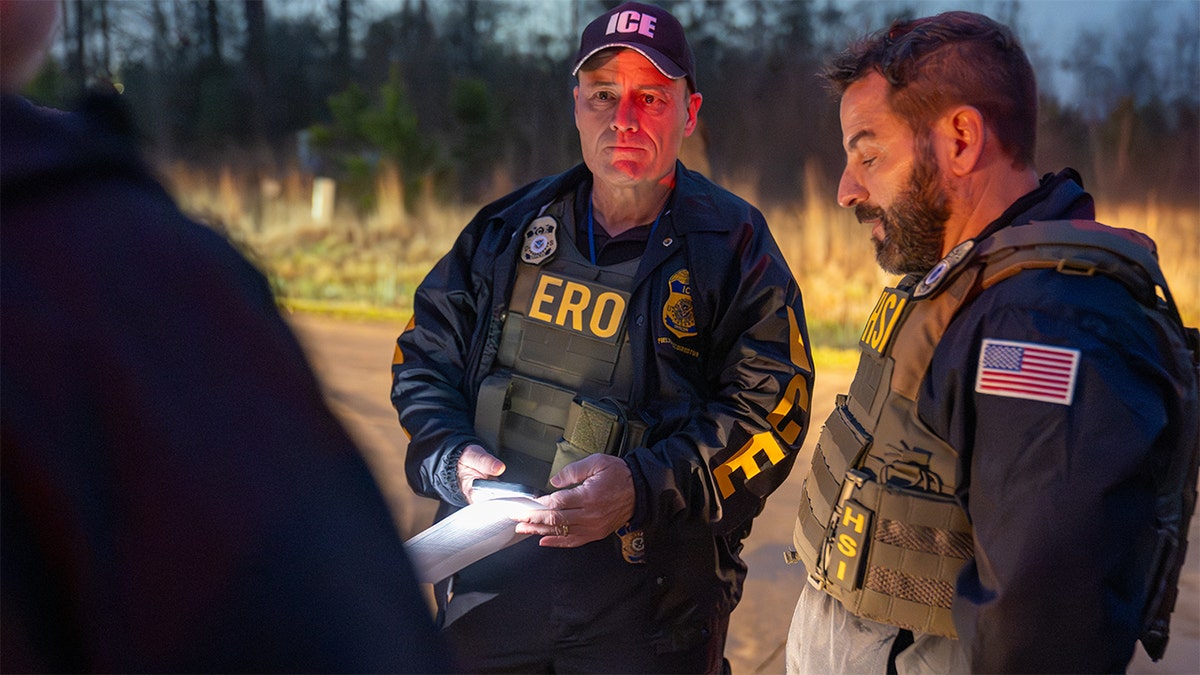
The legislation would fund all of DHS except Immigration and Customs Enforcement and Customs and Border Protection, which Democrats have refused to vote for without significant reforms to immigration raids and deportation practices.
The deal followed arduous bipartisan negotiations that occurred in fits and starts over the last six weeks, succumbing to the impasse around policy changes to immigration enforcement. Under the new plan, Democrats get their weeks-long demand to fund the department with the exceptions of ICE or CBP, but also without the restrictions they sought on how immigration officers may conduct operations.
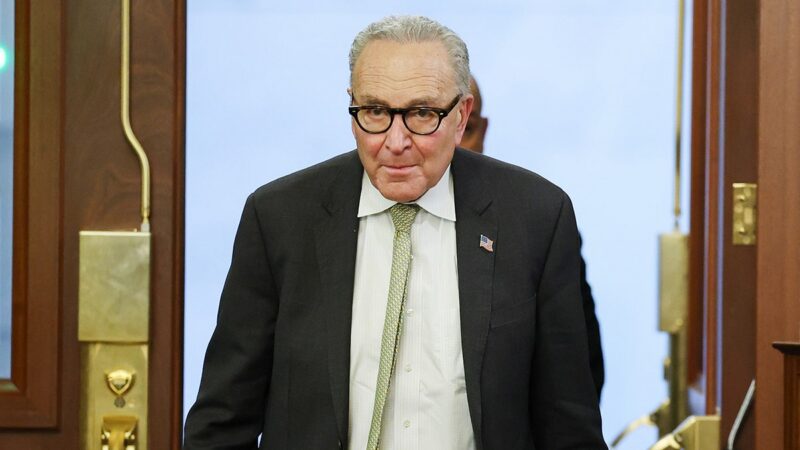
“This could have been done three weeks ago,” Senate Minority Leader Chuck Schumer, D-N.Y., said. “This is exactly what we wanted.”
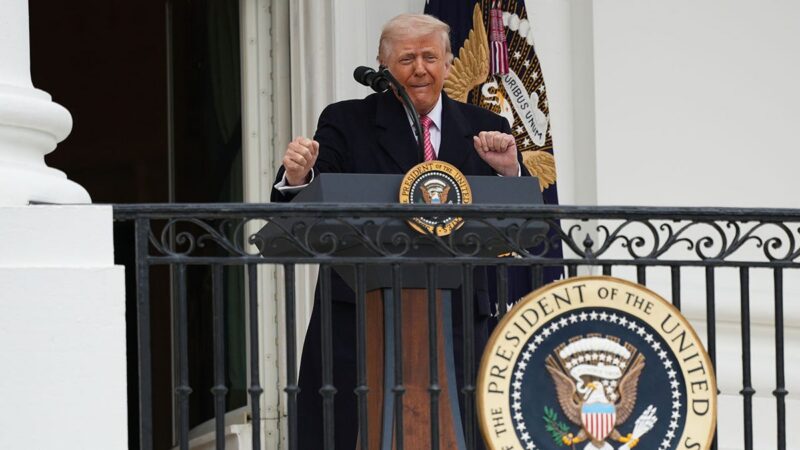
The bill faces an uncertain future in the Republican-controlled House. It is expected to have President Donald Trump’s support, which could help corral conservatives who have been skeptical about splitting off ICE funding from the underlying bill.
“Hopefully they’ll be around, and we can get at least a lot of the government opened up again, and then we’ll go from there,” Senate Majority Leader John Thune, R-S.D., said of the House and a potential vote on Friday. He said he texted with Speaker Mike Johnson, R-La., on Thursday night.
The Senate adjourned for a two-week recess, leaving the House with few options other than to accept their bill as written.
Thune separately blamed Democrats. “President Trump should never have had to step in to rescue TSA workers and U.S. air travel. We are here because, thanks to Democrats’ determined refusal to reach an agreement, there will be no Homeland Security funding bill this year.”
Speaking after the vote, Schumer said: “In the wake of the murders of Renee Good and Alex Pretti, Senate Democrats were clear. No blank check for a lawless ICE and Border Patrol.”
He added that the “long overdue agreement” funds TSA, the Coast Guard, the Federal Emergency Management Agency and the Cybersecurity and Infrastructure Security Agency, and “strengthens security at the border and the ports of entry, and keeps Americans safe.”
He added that the deal “could have been accomplished weeks ago if Republicans hadn’t stood in the way.”
The White House and Republicans declined to grant Democrats’ demands to restrict Trump’s immigration practices. They now plan to pursue the remainder for funding for ICE and CBP in a separate party-line bill, which they could also use to pass Iran war funding and elements of the Trump-backed SAVE America Act.
Senate Republicans held a vote open for hours Thursday as the two sides continued to negotiate, having traded offers for days.
Trump, meanwhile, announced earlier Thursday that he would instruct newly sworn-in Homeland Security Secretary Markwayne Mullin to “immediately pay our TSA Agents in order to address this Emergency Situation.”
That move may not be needed if the House passes the Senate legislation, according to a senior administration official, who said the White House is waiting to see what will happen.
This official also said the funds to pay TSA agents would come from the so-called One Big Beautiful Bill, the tax-cut and spending legislation Trump signed into law in July. It’s not clear exactly how that would work, but the administration has dipped into those unspent funds before to cover pay gaps during funding lapses.
The House can either debate and vote out the Senate-passed measures in the Rules Committee before bringing them to the floor under a simple majority vote, or Johnson can seek to fast-track it to the floor.
The House was set to hold an unrelated vote at 10 a.m. before leaving for recess.
We’d like to hear from you about how you’re experiencing the partial government shutdown, whether you’re a TSA agent who can’t work right now or a federal employee who is feeling the effects at your agency. Please contact us at tips@nbcuni.com or reach out to us here.
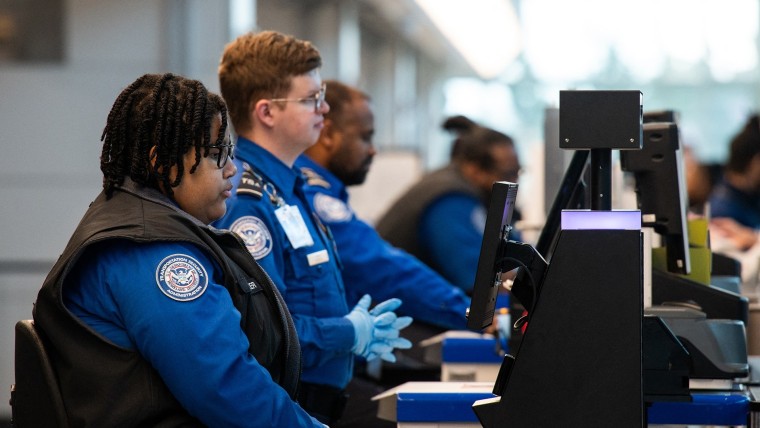
TSA officers missed their first full paychecks in mid-March, leading many to call out of work. Call-out rates for TSA officers have exceeded 11% nationally, with rates at some airports passing 40%.
Trump sent ICE agents to airports to help TSA earlier this week. Unlike TSA officers, ICE agents continue to receive paychecks during the partial shutdown as a result of funding from the so-called One Big Beautiful Bill, a sweeping GOP domestic policy package, that Trump signed into law last year.